可观测宇宙的地图
(原标题: A Map of the Observable Universe)
2023-07-05
浏览次数: 1626
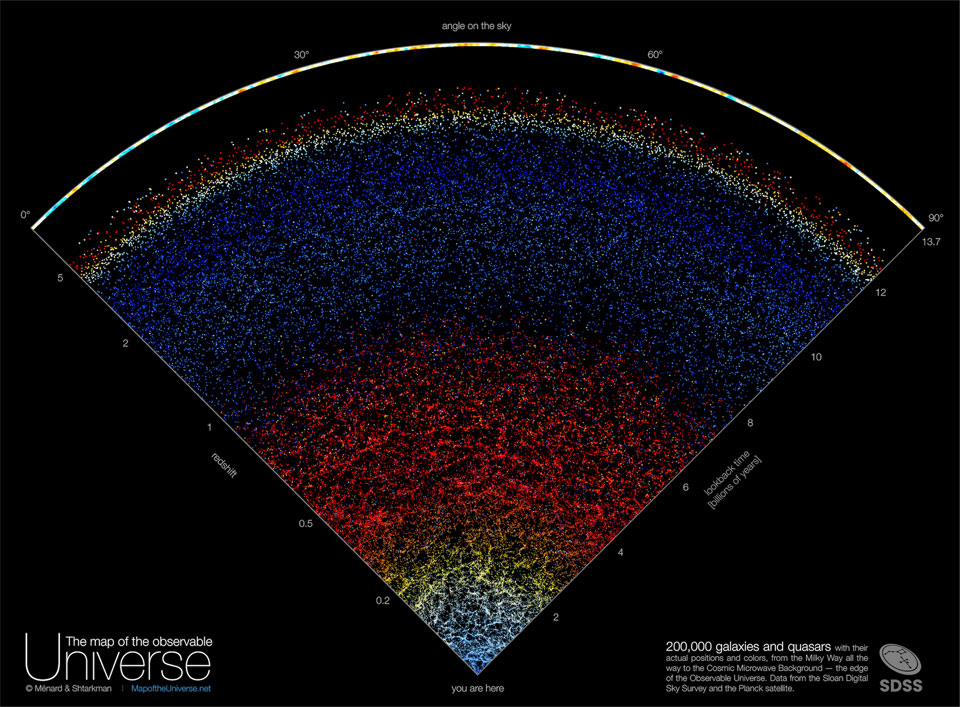
如果你能看到可观测宇宙的边缘呢?你会看到星系,星系,星系,然后,类星体,它们是遥远星系的明亮中心。为了扩大对人类所能看到的最大尺度的理解,斯隆数字巡天(Sloan Digital Sky Survey)从2000年到2020年发现的星系和类星体的地图——一直延伸到可观测宇宙的边缘——已经被绘制出来。在这里,这个调查中的一个楔形包含了大约20万个星系和类星体,超越了120亿年的回顾时间和宇宙红移5。图中靠近下方的几乎每个点都代表一个星系,红色表示红移和距离的增加。同样,图上几乎每个点都代表一个遥远的类星体,蓝色阴影的点比红色的点更近。在许多发现中清楚地显示,星系之间的引力导致附近的宇宙凝结,比遥远的宇宙变得越来越丝状。更详细的地图:与今天的APOD有关
查看原文解释
What if you could see out to the edge of the observable universe? You would see galaxies, galaxies, galaxies, and then, well, quasars, which are the bright centers of distant galaxies. To expand understanding of the very largest scales that humanity can see, a map of the galaxies and quasars found by the Sloan Digital Sky Survey from 2000 to 2020 -- out to near the edge of the observable universe -- has been composed. Featured here, one wedge from this survey encompasses about 200,000 galaxies and quasars out beyond a look-back time of 12 billion years and cosmological redshift 5. Almost every dot in the nearby lower part of the illustration represents a galaxy, with redness indicating increasing redshift and distance. Similarly, almost every dot on the upper part represents a distant quasar, with blue-shaded dots being closer than red. Clearly shown among many discoveries, gravity between galaxies has caused the nearby universe to condense and become increasingly more filamentary than the distant universe. More Detailed Maps: Related to Today's APOD
© B. Ménard & N. Shtarkman; Data: SDSS, Planck, JHU, Sloan, NASA, ESA